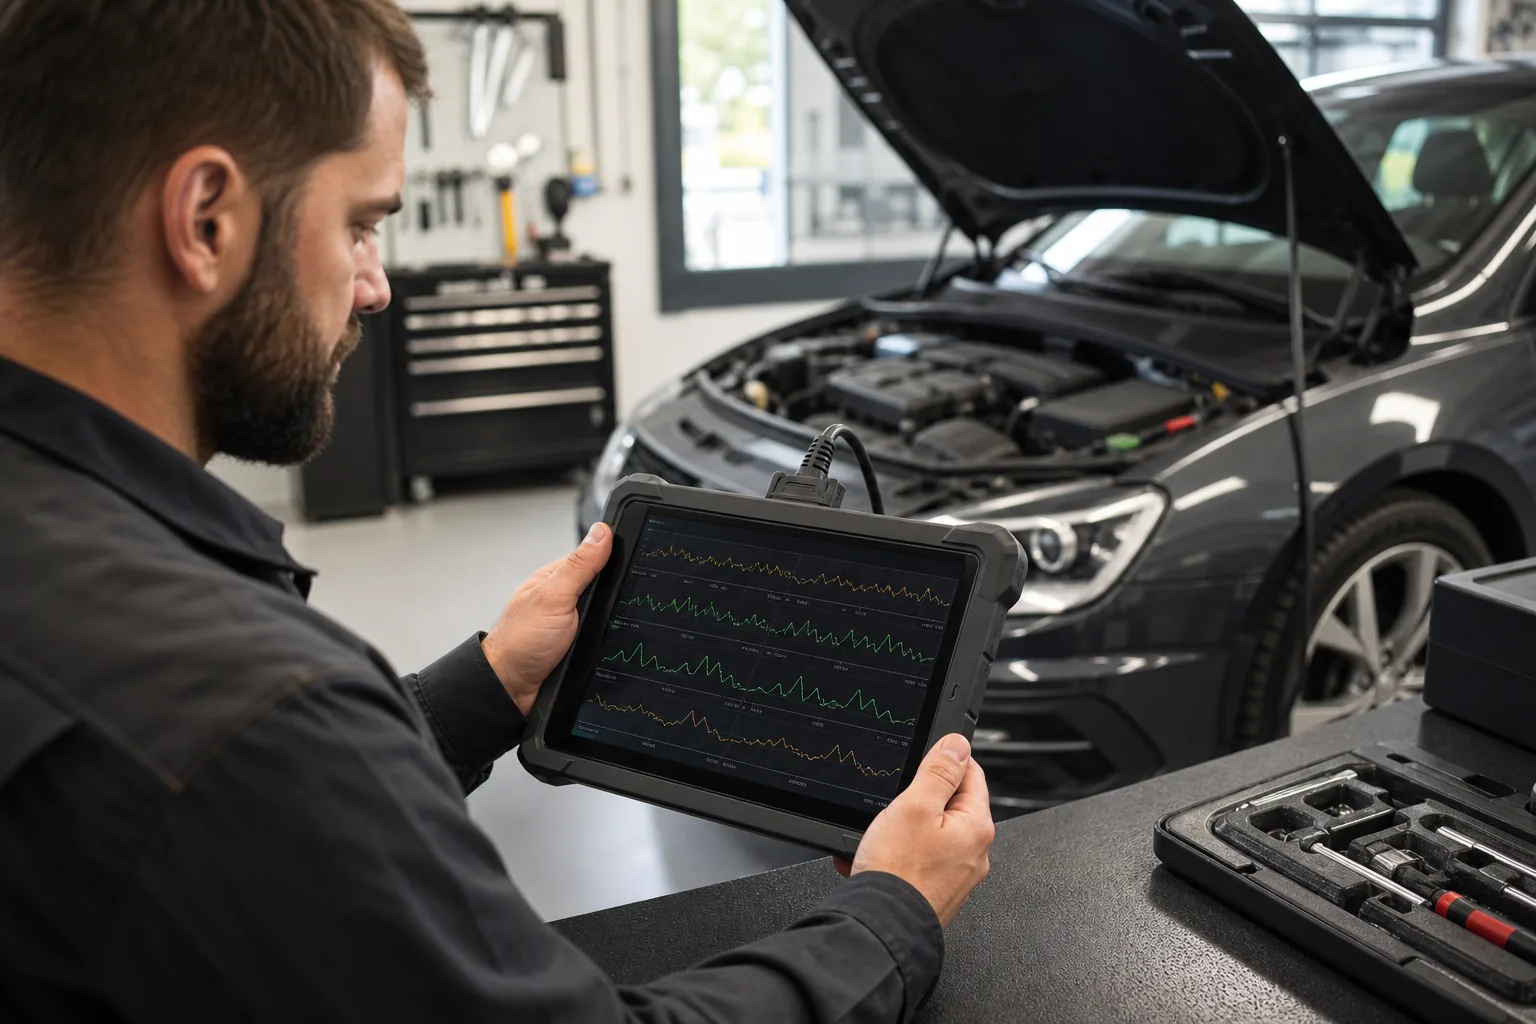
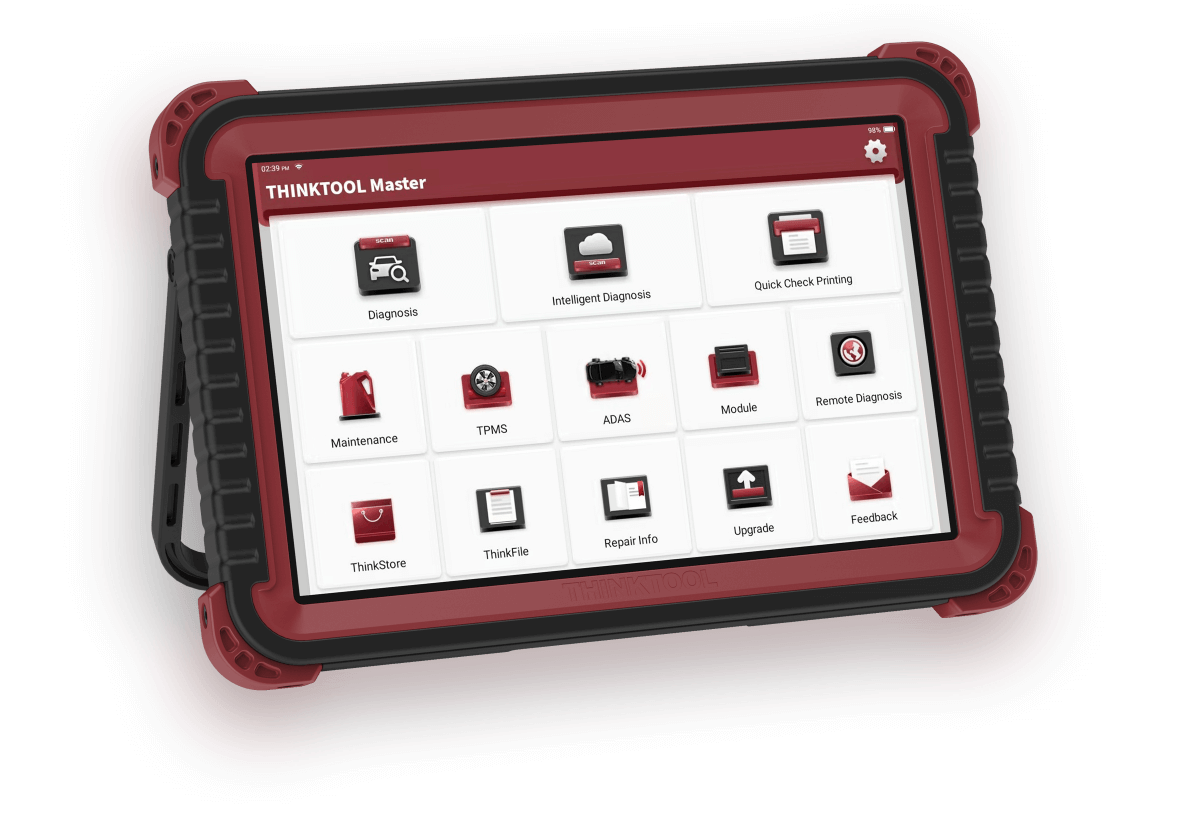
Live data displays the values that the control unit receives from sensors or calculates internally during operation. This display does not automatically identify the faulty part; it allows the technician to examine voltage, temperature, pressure, RPM, switch status, and the relationship between commanded and actual values. For a healthy interpretation, the correct vehicle is selected, the customer complaint is reproduced, a small number of relevant parameters are recorded under the same conditions, and the results are compared with technical nominal values. Instead of making a part decision from a single instantaneous number, codes, circuit checks, graphs, and physical measurements are used together.
Live data on a diagnostic device is the transfer of parameters that the control unit sees or calculates at that moment to the screen. Examples include engine speed, coolant temperature, fuel pressure, wheel speed, pedal position, or switch status. The value on the screen may not be a direct physical measurement of the sensor; it may be a result filtered, converted, or calculated by the control unit from other inputs.
A temperature sensor produces voltage or its resistance changes; the control unit converts this into a temperature value. The device displays the temperature on the screen. When the wiring is short-circuited, the observed temperature is not the actual engine temperature but how the control unit interprets the faulty circuit. Therefore, live data can be verified with electrical measurements.
"Desired" and "actual" values have different meanings. Turbo pressure target shows the value the control unit wants to reach, while actual pressure shows the result from the sensor. The difference between them can relate to the actuator, leak, sensor, mechanical load, or control strategy. Looking only at the actual value loses the command context.
Some parameters are manufacturer-specific; their name, unit, and scale may vary depending on the device software. The same abbreviation can mean different things for two brands. A single threshold value found online cannot be applied to all vehicles without reading technical documentation and device descriptions.
Visual summaryLive data diagnostic chain
01
ComplaintDefine the condition under which the problem occurs
02
HypothesisWhich system might be involved?
03
Parameter groupSmall and interrelated data
04
VerificationNominal information and physical measurement
The test question is determined first; instead of opening all parameters on the screen simultaneously, a small, relevant group is recorded. Recording is useful for intermittent faults.
Decision guide
How are error codes, freeze-frame, and live data used together?
An error code indicates which condition the control unit found abnormal. Freeze-frame can store selected operating data at the moment the code was recorded. Live data allows monitoring the system's behavior while reproducing the problem. All three are different parts of the same diagnostic chain; none is a standalone parts order list.
Clearing codes before the initial scan can lose the context of RPM, load, temperature, and speed at which the fault occurred. If the customer says, "It only happens in the morning," a different hypothesis forms when the freeze-frame shows the engine is warm. The scan report is saved with the date, mileage, and customer complaint.
A code might say "sensor signal low"; this does not necessarily mean the sensor is definitively faulty. The power supply, ground, signal wire, connector, and control unit input can also produce the same result. If the live data value is illogical, the actual signal produced by the sensor is compared with circuit measurements.
The recording feature becomes important for intermittent faults. Relevant parameters and event markers are recorded throughout the test drive. At the moment the problem occurs, it is examined which value changed first on the graph. The error code result and the time sequence help understand the possible cause.
Decision guide
How to select the correct parameter group?
Opening hundreds of parameters on a control unit simultaneously does not simplify diagnosis. When the data bus and device screen update many values sequentially, the sampling rate can drop; short-term deviations may be missed. Selecting five to ten related parameters that explain the complaint often yields more readable results in most tests.
For a difficult operating complaint, values such as engine speed, battery voltage, fuel pressure target-actual, synchronization, and temperature can be selected. For an ABS complaint, all four wheel speeds are compared on the same graph. For DPF evaluation, differential pressure, exhaust temperatures, and regeneration status are monitored in the same context. The list is built according to the fault.
First, the system's operating logic is mapped out: which sensor provides information to the control unit, which actuator does the ECU command, and what is the expected feedback? Parameters are selected to represent this chain. A hypothesis is tested rather than randomly monitoring popular PIDs.
If the device can save favorite lists or custom data groups, templates can be created for frequently repeated tests in the service. Templates do not replace model-specific values. Parameter names and units are recorded in the report; the next measurement is compared under the same conditions.
Few values related to the complaint
Command and feedback pair
Comparison of similar sensors
Correct unit and sampling rate
Visual summaryCommanded and actual value
01
Target valueThe state the control unit aims to achieve
02
Actual valueThe result reported by the sensor or calculation
03
DeviationExplained by circuit, mechanical system, and conditions
Seeing a deviation does not solely blame the part; command, feedback, and operating conditions are read together.
Decision guide
Live data is interpreted along with test conditions
Whether a value is normal depends on the engine being cold or hot, idle, load, vehicle speed, electrical consumption, and ambient conditions. The statement "Fuel pressure 300" is not useful without units, engine type, and operating status. The measurement condition is part of the service report.
Before starting the cold engine, air temperature, coolant, and intake air temperatures can be expected to be close to each other. A significant deviation provides a clue for the sensor or circuit. After the engine warms up, the same comparison loses its meaning. Simple ambient comparison can be more reliable than searching for random thresholds.
Fuel or air values that appear normal at idle may deviate under load. If a test drive is required, a safe route, a second person, or the recording function is used; the technician does not look at the screen while driving. If the vehicle is to be tested stationary, safety must be ensured for fans, exhaust, and moving parts.
If the battery voltage is low, many sensor and actuator values can be affected. Communication errors may occur. System voltage is checked before starting diagnosis. Adequate power support is used, especially during programming or active testing; the voltage seen on the live data screen can be compared with external measurements.
Decision guide
When to use graph, list, and record views?
List view is suitable for general checking of many values. Graph shows the relationship between two or more parameters over time. Recording allows examining intermittent faults after a test drive. A good diagnostic device should offer quick switching between these views and the ability to export reports.
Overlaying the four wheel speeds on a graph can make a sensor signal that drops at low speed more visible than in a list. HELLA's ABS sensor guide also recommends comparing different wheel speeds and evaluating the signal curve with an oscilloscope if necessary. The graph shows an anomaly; the cause of the circuit must be investigated separately.
Pairs such as target and actual fuel pressure, throttle command and position, or turbo pressure are monitored on the same time axis. If the actual value lags behind the target, a mechanical, hydraulic, or control problem may be considered. However, acceptable lag and tolerance must be obtained from manufacturer data.
A note about the test condition is added to the recording file: e.g., third gear acceleration, hot idle, AC on, or cold start. The file name should not be just the vehicle license plate; date and complaint should also be included. Personal data is stored securely.
Visual summaryOperating conditions that change the graph
Technical signals
01
TimeBefore and after the event
02
Engine RPMIdle or controlled speed
03
LoadThrottle and driving conditions
04
TemperatureSystem operating phase
The same number can have different meanings when the engine is cold or hot, at idle, or under load.
Decision guide
How to find nominal values and comparison sources?
Live data is just a crowd of numbers without knowing the expected value. The most reliable comparison is the vehicle manufacturer's technical data, a guided test plan, or documentation from a reputable parts manufacturer. Min-max information in the device software can be helpful. Values from another engine code found online are not directly applicable due to the same model name.
Nominal values can be provided as a range or with specific test conditions. Values like fuel pressure, mass air flow, and temperature vary with engine RPM and load. Taking only an idle number and comparing it under road load is erroneous. The preconditions and units in the documentation must be strictly followed.
Similar sensors in the same vehicle offer a reference group that can be compared under common operating conditions. Values such as four wheel speeds, dual exhaust temperature sensors, or two camshaft positions can be examined relative to each other under specific conditions. A result of "not the same as others" does not definitively confirm a part failure; differences in system structure and position must be taken into account.
Comparison with a known good vehicle can be useful, but the software version, engine, and hardware must be the same. The service can create its own anonymized reference records. These records are used to support real workshop experience, not to replace manufacturer nominal values.
Decision guide
How to verify sensor values with physical measurements?
Diagnosis is strengthened when the value seen by the control unit is compared with the physical reality. Coolant temperature can be verified with non-contact measurement or ambient comparison after waiting, pressure with a mechanical manometer, voltage with a multimeter, and fast electrical signals with an oscilloscope. The method used depends on the system and safety conditions.
A multimeter may show an average value and miss short interruptions. For fast signals like crankshaft or wheel speed sensors, an oscilloscope helps visualize the waveform. HELLA presents oscilloscope signal evaluation as a separate method alongside live parameters in ABS sensor diagnostics. The devices are used to complement each other, not replace each other.
It is possible for the ECU to display a default value when the sensor connector is removed. This value should not be mistaken for the actual sensor measurement. The status flags on the scan device, error codes, and electrical diagrams should be examined. If back-probing is to be done, use appropriate tips that do not damage the connector.
A mechanical problem can cause indirect electronic symptoms. Low compression, vacuum leaks, or sticking valves affect sensor readings. Instead of replacing a sensor because its data is abnormal, investigate why the value has changed. The goal of diagnosis is not to force the number to normal but to find the root cause.
Visual summaryEvidence check before part decision
01
Code contextFreeze-frame and fault conditions
02
Data repetitionDoes it reoccur under the same conditions?
03
Circuit measurementPower, ground, and signal check
04
Mechanical resultPhysical behavior of the system
Live data guides diagnosis; reliable part decisions are supported by independent evidence.
Decision guide
Common interpretation errors in live data
The first mistake is to directly consider a red value on the screen as faulty. The device's color limit may be general and not match the vehicle variant. The second mistake is mixing units: kPa, bar, psi; Celsius and Fahrenheit; grams/second and kg/hour are different. The third mistake is interpreting a dynamic system with a single snapshot.
Percentage values also require attention. Throttle or pedal position may not start from zero on some vehicles; there may be a reverse scale or two channels. The conclusion "Shows 15 percent without throttle input, it's faulty" cannot be established without technical documentation. It is examined whether the two channels move in the same direction and at the expected ratio relative to each other.
Calculated values are not sensor values. Engine load, DPF soot load, or torque demand may be model results generated from multiple inputs. These values are not presented as mechanical measurements. Faults in sensors affecting the calculation are sought separately.
Assuming the system is fine if there is no error code is also incorrect. A value may remain within a reasonable electrical range but be physically incorrect; the ECU may not generate a code. Therefore, customer complaints, comparisons, and physical tests are performed along with live data.
Decision guide
What features are important when selecting a device for live data?
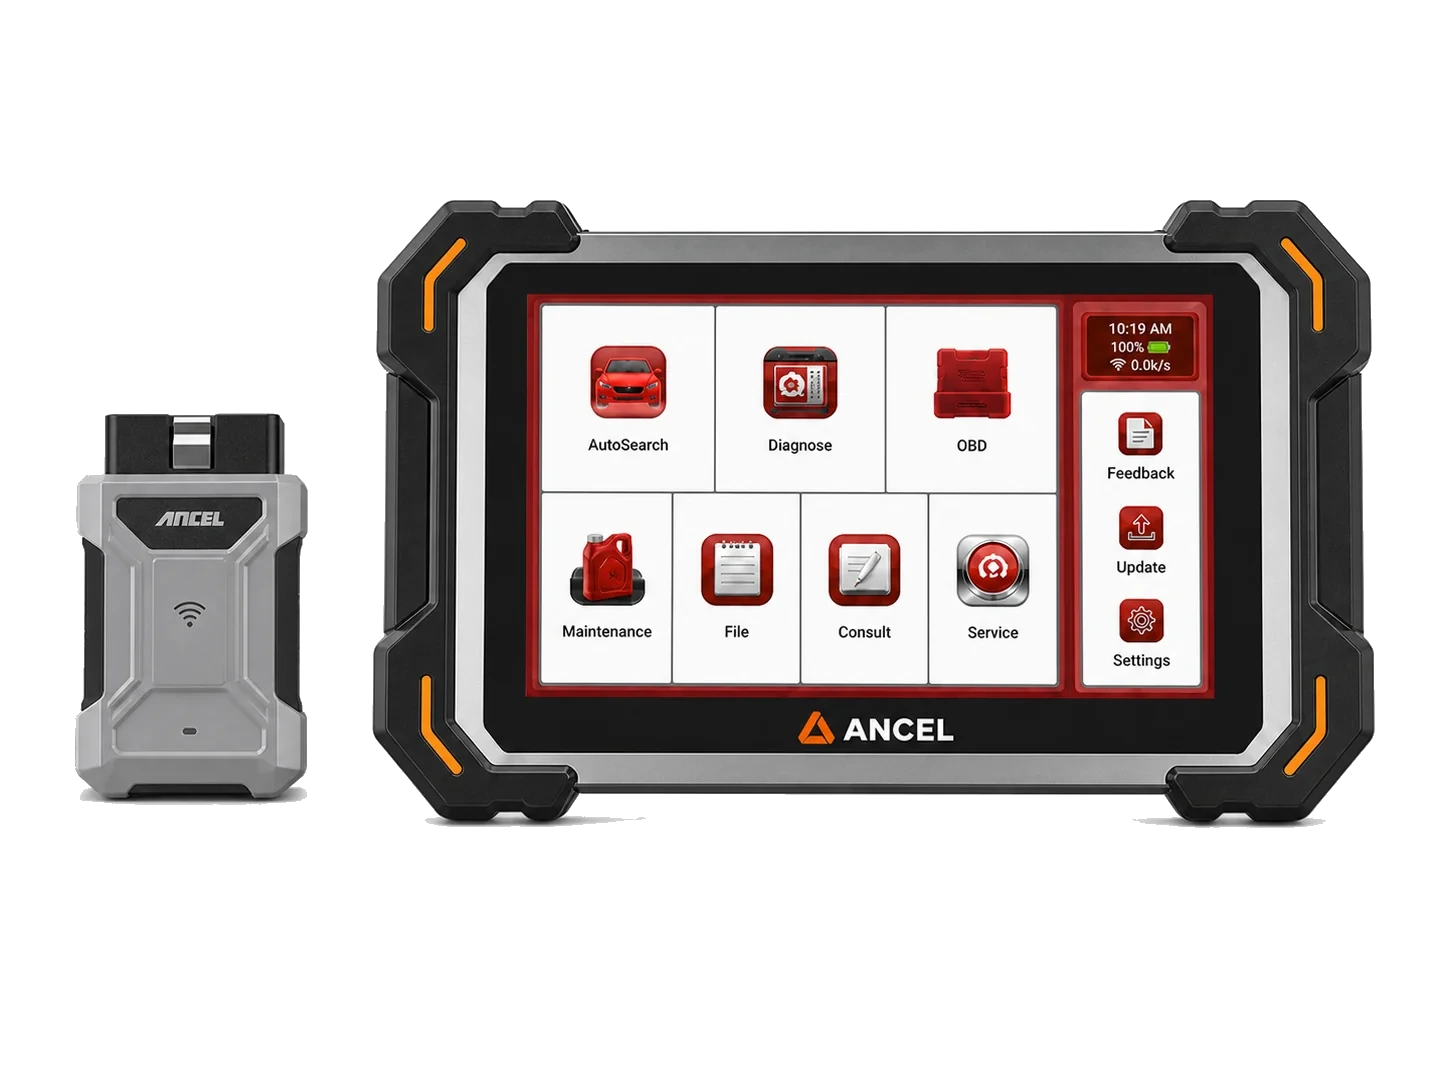
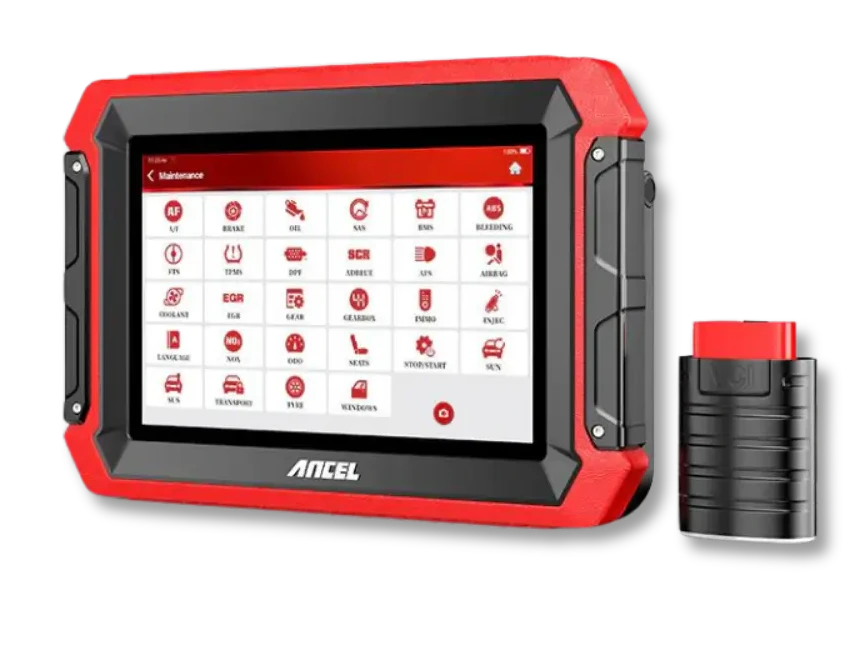
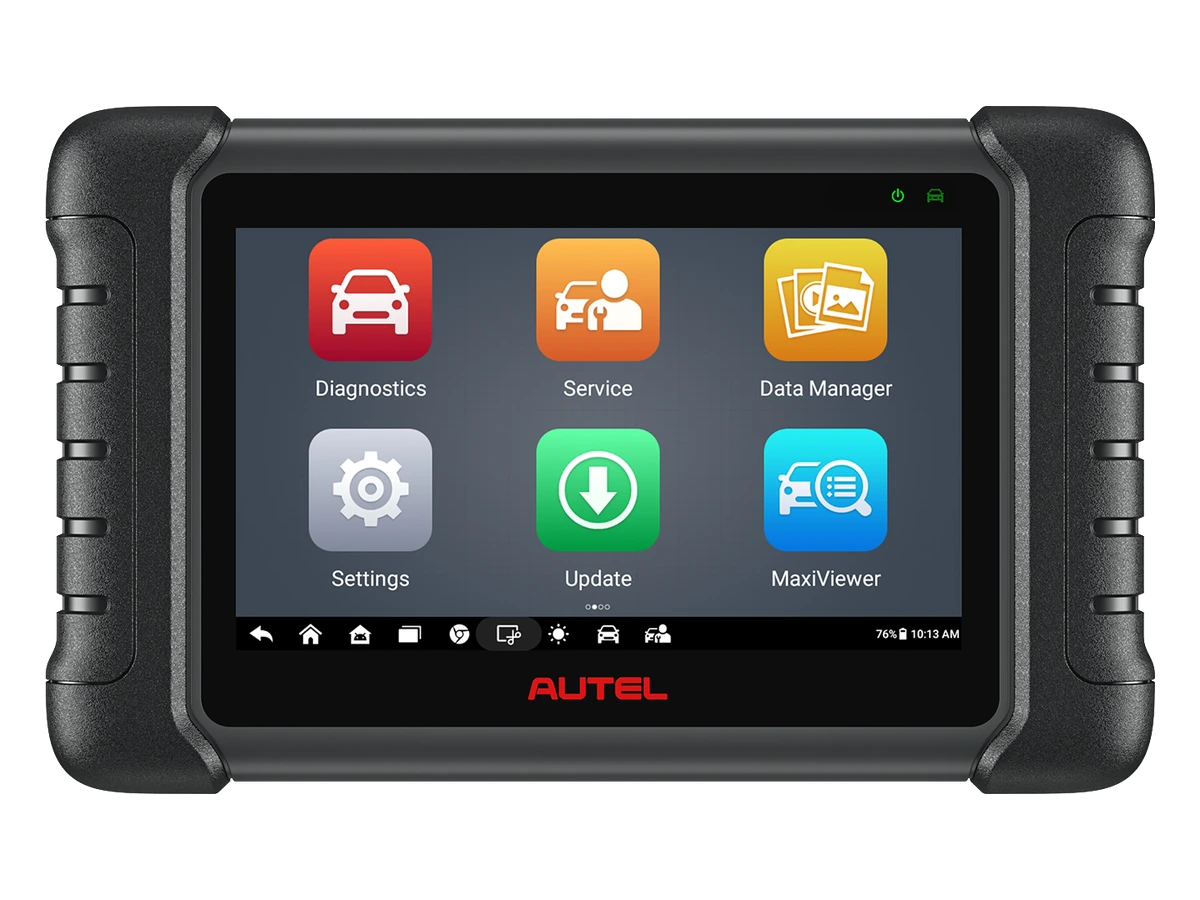
In a service device, in addition to broad vehicle coverage, look for fast data refresh rates, custom PID selection, multi-graphing, recording, playback, and report export capabilities. The screen showing a readable number of graphs simultaneously and clear units simplifies daily work. A Bluetooth VCI can provide mobility during test drives; connection stability should also be evaluated.
A basic OBD device can display standard engine data. A multi-system service tablet can access ABS, airbag, transmission, body, and other manufacturer-specific parameters. Which control units' live data is needed is determined from the service profile. Ask for actual PID coverage rather than numerous brand logos.
Topology scan and system report help to see the big picture before live data testing. Guided testing or technical information integration can speed up finding nominal values. These features vary depending on the device class and license package; they should be clearly verified on the product page.
If recordings need to be transferred to a computer or to the customer, test the file format and report sharing. A screenshot alone may be insufficient for long tests. Before purchasing a workshop device, test the operating experience by opening a recording on a demo vehicle and playing back the graph.
Custom PID selection
Fast sampling
Multi-graph
Record and playback
Report export
Decision guide
Final diagnostic check before part replacement
Live data anomalies are initial evidence for part replacement, not the final decision. The relevant error code and freeze-frame are saved, the value is reproduced under the same conditions, power and ground are checked, physical measurements are taken, and if possible, a command-actual comparison is established. After repair, the same test is repeated to confirm the replacement.
If adaptation or basic settings are required after replacing a part, follow the manufacturer's procedure. Old and new recordings are compared with the same graph scale and conditions. The disappearance of the complaint, the non-return of the error code, and the value returning to expected behavior collectively support the repair outcome.
Instead of giving the customer hundreds of PID dumps, explain meaningful findings: e.g., the commanded pressure and measured value diverged under load, a connection issue was found in the circuit measurement, and values matched after repair. Technical reports should be understandable and evidence-based.
The ability to read live data is more valuable than the number of features on a device. The right device provides fast, reliable, and extensive data; however, the technician formulates the hypothesis. When making a purchasing decision, consider not only the device's ability to display data but also the quality of selecting, comparing, recording, and sharing it.
Frequently Asked Questions
Most frequently asked questions by customers
Does live data directly indicate a faulty part?
No. It shows the value seen or calculated by the control unit. Verification with codes, circuits, nominal values, and physical measurements is required for part diagnosis.
Why can selecting too many parameters be detrimental?
When the device and data bus update parameters sequentially, a very long list can reduce sampling speed. A small number of PIDs related to the complaint provides more readable graphs.
Are freeze-frame and live data the same?
No. Freeze-frame stores selected data at the moment the fault occurred; live data shows current values during testing.
Does seeing a deviation in a graph prove the sensor is faulty?
No. Wiring, power supply, mechanical system, or another sensor can cause the same deviation. The cause must be verified with electrical and physical measurements.
What device class is required for live data?
A basic OBD reader may be sufficient for engine data only. A multi-system service requires a service tablet offering manufacturer-specific PIDs, fast graphing, recording, and reporting.